How I Crashed Our Production Database - And Fixed It by Making Search 90x Faster
A full table scan across 700K+ rows took down our database. Here's how trigram indexes and normalization brought it back.
The Crash
March 9th, 2026. Our production database went down.
HealthPilot serves doctors across India - many in rural clinics with spotty internet. The core workflow is simple: search for a medicine, add it to a prescription, done. Except it wasn't done. It was broken.
Doctors were complaining for days. "Search is slow." "Medicine didn't show up." "I added it manually." What we didn't realize was that every slow search was a full table scan across 700,000+ rows, eating our entire 2GB of database RAM until the server gave up.
The Symptoms
Doctors in low-bandwidth areas were experiencing 2+ second search times. On really slow connections, even longer. The UX problem was brutal: you type "Amoxicillin", wait 3 seconds, see nothing, assume it's not in the database, and manually add it. Now we have duplicate entries. Multiply that across hundreds of doctors and thousands of searches per day.
Then the database crashed. Our Supabase instance - Small tier, 2GB RAM - ran out of memory. That's when Vikranth and I stopped patching and started digging.
The Diagnosis
Running EXPLAIN ANALYZE on Production
First rule of optimization: measure, don't guess.
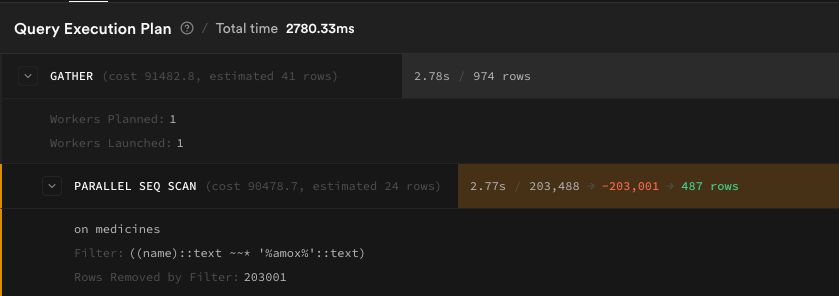
EXPLAIN ANALYZE SELECT * FROM medicines WHERE name ILIKE '%amox%';
medicines table (407K rows):
otc_medicines table (300K rows):
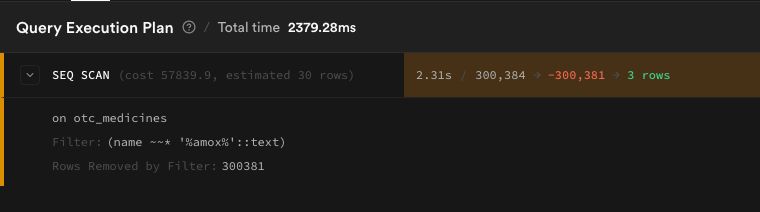
There it was. Every single search triggered a full table scan. The ILIKE '%query%' pattern - which looks completely harmless - can't use standard B-tree indexes. PostgreSQL has to read every single row, every single time.
The Memory Problem
Then we checked table sizes:
| Table | Rows | Size |
|---|---|---|
| medicines | 406,976 | 1.4 GB |
| otc_medicines | 300,384 | 521 MB |
Combined: ~2 GB. Our total RAM: 2 GB.
Why were these tables so massive? Each row had 20+ columns, most of them large text blobs - drug interactions, descriptions, safety advice, usage instructions. Data that's only needed when you click on a specific medicine, but was being loaded into memory on every search.
And otc_medicines had 8 completely empty columns taking up space. We verified:
SELECT
  COUNT(*) FILTER (WHERE alcohol_interaction IS NOT NULL) as alcohol,
  COUNT(*) FILTER (WHERE pregnancy_interaction IS NOT NULL) as pregnancy,
  COUNT(*) FILTER (WHERE driving_interaction IS NOT NULL) as driving
FROM otc_medicines;
All zeros. Dead weight.
The Fix
Three changes, each compounding on the last.
1. Trigram Indexes - The Instant Win
PostgreSQL has a pg_trgm extension that breaks strings into 3-character grams ("amo", "mox", "oxi", "xic", ...) and builds a GIN index. This makes ILIKE '%query%' use an index scan instead of reading every row.
CREATE INDEX idx_medicines_name_trgm
  ON public.medicines USING gin (name extensions.gin_trgm_ops);

CREATE INDEX idx_otc_medicines_name_trgm
  ON public.otc_medicines USING gin (name extensions.gin_trgm_ops);
Two lines of SQL. The result:
| Table | Before | After | Improvement |
|---|---|---|---|
| medicines | 2,780 ms | 30.89 ms | 90x faster |
| otc_medicines | 2,379 ms | 10.19 ms | 233x faster |
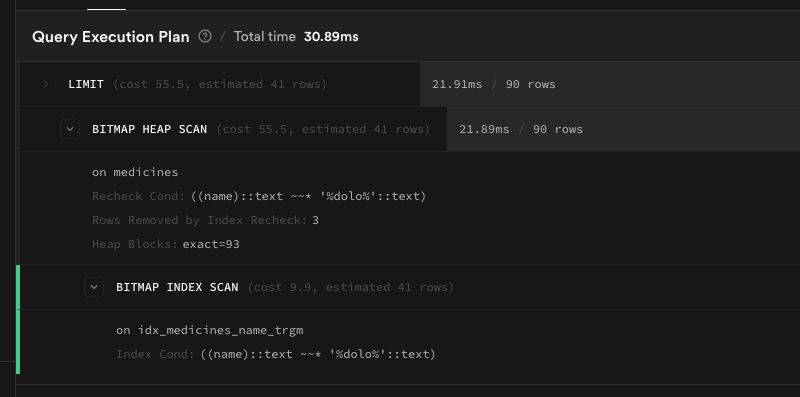
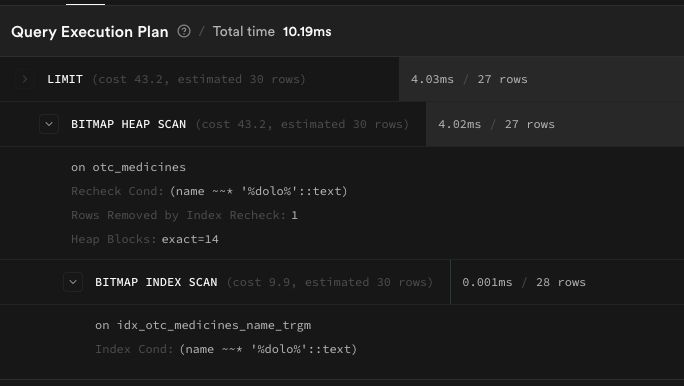
From two seconds to thirty milliseconds. Same query, same data, just a better index. Took us 20 minutes to diagnose and deploy.
2. Table Normalization - Fixing the RAM Crisis
Fast queries don't matter if your database keeps crashing. The root cause was table width - every row carried huge text blobs that had no business being in the core table.
Before:
medicines (407K rows × 26 columns = 1.4 GB)
├── id, name, salt_composition, mrp     ← needed for search
├── introduction, description, benefits  ← only for detail view
└── 7 interaction columns               ← rarely accessed
After:
medicines (407K rows × 13 columns)
medicine_details (407K rows × 14 cols)  ← joined only when needed
Same split for otc_medicines → otc_medicine_details.
The migration was the scary part. You can't just DROP COLUMN on a production table with 407K rows of data. The order matters:
- Create new detail tables
INSERT INTO ... SELECTto copy data- Verify row counts match exactly
- Deploy code that reads from new tables
- Then drop old columns
VACUUM FULLto reclaim space
We split this into separate migrations and ran data copies manually. Supabase's db diff only captures schema changes - it doesn't know about data migration. One wrong step and we'd lose drug interaction data for 700K+ medicines permanently.
3. Client-Side Polish
- Page size: 200 → 30 - Doctors pick from the first few results. No need to ship 200 over a 2G connection.
- Debounce: 150ms → 400ms - Fewer API calls while typing.
- Server cache: 60s → 5min, 200 → 500 entries - Medicine data doesn't change every minute.
- Minimum query length: 3 - Garbage input like "asdfghjk" now returns empty results and shows "Add Medicine" instead of random matches.
- Slow search indicator - If search exceeds 2 seconds, show "Still searching, please wait..." so doctors don't assume it failed.
The Results
| Metric | Before | After |
|---|---|---|
| Search query time | 2,780 ms | ~30 ms |
| medicines table size | 1.4 GB | ~400 MB (est.) |
| otc_medicines table size | 521 MB | ~150 MB (est.) |
| DB memory pressure | ~2 GB (100%) | ~550 MB (~27%) |
| Network payload | 200 results | 30 results |
No more crashes. No more phantom "medicine not found." No more duplicates.
What I Learned
ILIKE is a trap. It reads like simple code. It works fine on 100 rows. It kills your database at 400K rows. If you're doing pattern matching at scale, use pg_trgm - it's built into PostgreSQL and takes two lines to set up.
Wide tables waste memory even when you don't SELECT *. PostgreSQL stores full rows on disk. Even with explicit column selects, the heap pages are bloated. Normalize aggressively for tables that will grow.
EXPLAIN ANALYZE on production, not local. Our local database had 100 rows. Everything was fast. Production had 407K rows and told a completely different story. Always measure where it matters.
The crash was a gift. Without it, we'd have kept patching the client side - adding loading spinners, increasing timeouts, telling doctors to be patient. The outage forced us to look at the actual problem. Sometimes your database crashing is the best thing that can happen to your product.
Built at HealthPilot - copilot for your health.